Originally published 23 July 2002
Someone asked me the other day why I became a scientist.
“Ah, that’s easy,” I replied. “I have always been interested in connections. Science is all about seeking the connections between things.”
When I thought about it later, I realized my answer was superficial.
After all, scientists are not the only ones interested in connections.
Insurance brokers and stock analysts are interested in connections.
Lawyers and doctors, too. Bus drivers and telephone engineers.
And besides, I was never really meant to be a scientist. Sooner or later, I would become a writer. Writers are interested in connections, too.
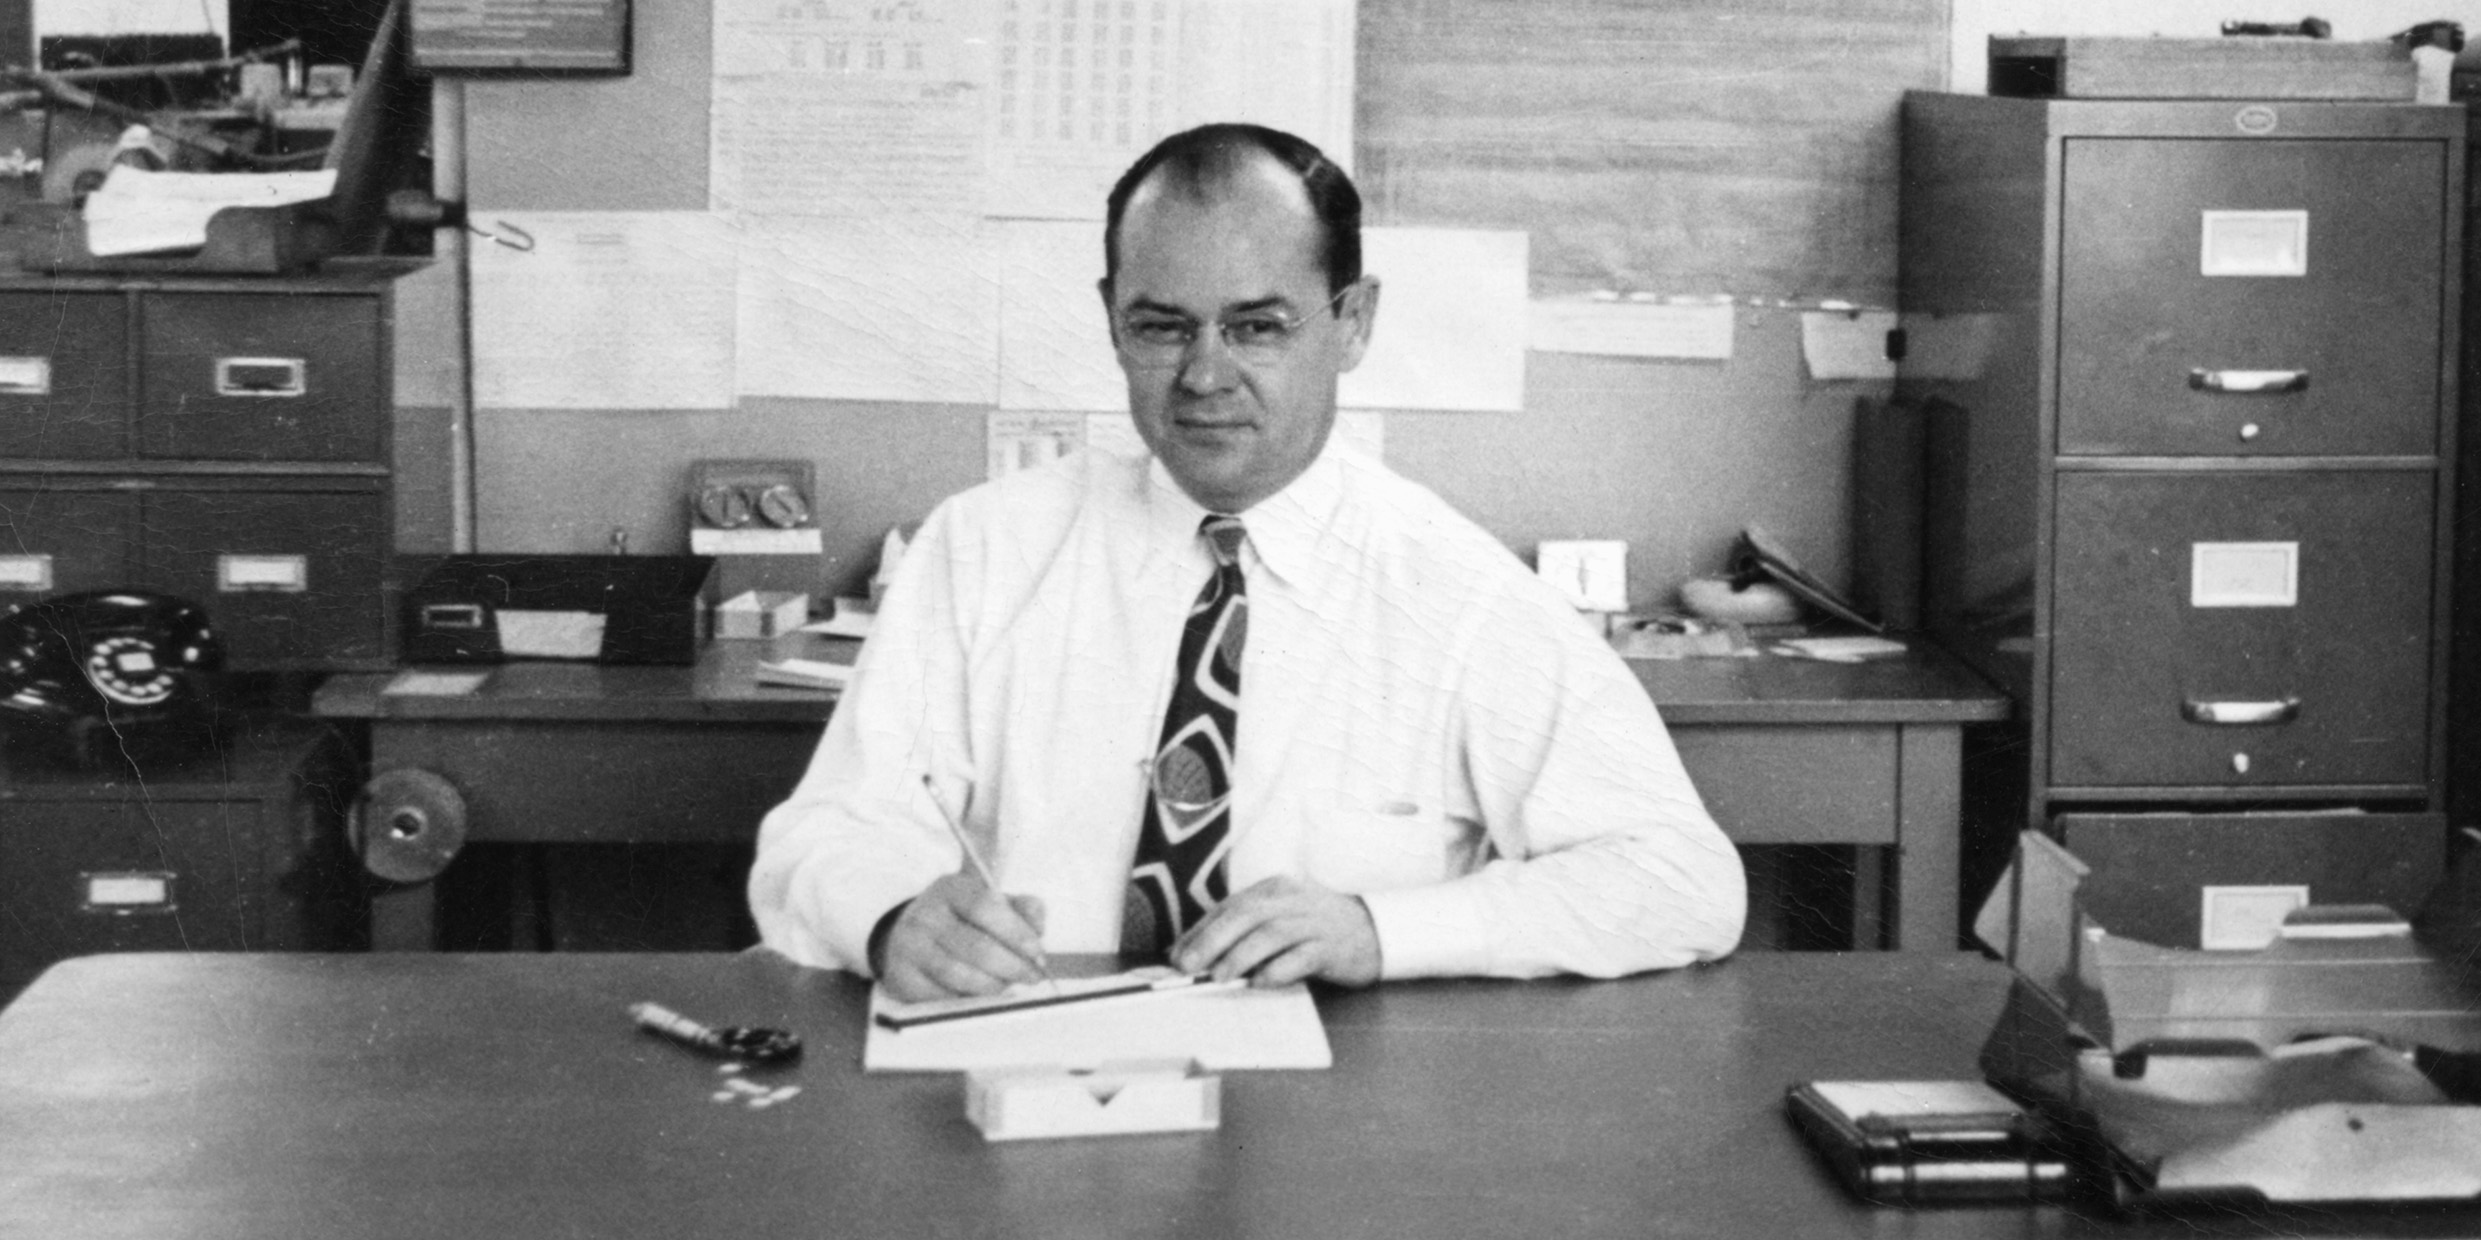
No, the reason I set out to become a scientist was because of my father.
Dad was an engineer in charge of quality control at a factory that made industrial ceramics, mostly tiny electrical insulators. Our house was full of boxes of ceramic chips, in every size and shape. It was like living in a money vault, except the coins were worthless.
Still, I used to plunge my hand into the boxes and let the chips slip through my fingers, like a Midas reveling in his wealth. All the chips in a particular box looked alike to me, but to my father each one was different. To be acceptable, the differences had to fall within certain exceedingly narrow tolerances. The tools of his trade were micrometers and calipers, lovely stainless-steel instruments that could measure things to a thousandth of an inch.
He taught me how to use the vernier scale on his calipers — a way of reading those thousandths of an inch — and told me it was named for its inventor, a 17th-century French mathematician named Pierre Vernier. The simplicity of the invention, and its usefulness for exact observation, impressed me as terribly clever.
As my father measured, he plotted. When I think of him, I think of graphs plotted in his neat hand on tissue-thin paper printed with a grid of faint green lines. “Hand me a sheet of K & E,” he’d say, which stood for the manufacturer of the paper, Keuffel and Esser.
K & E made his slide rule, too. And maybe the other tools in his kit.
His three-sided architect’s rule. His dividers and protractor. His triangles and French curves. His colored pencils, sharpened to a fine point. His gum eraser.
With these instruments, he made his graphs. Ordinates and abscissas.
Dependent and independent variables. He was a man in love with Cartesian coordinates. He told me the story of how philosopher René Descartes was lying in bed and watching a fly buzzing in a corner of the room. It occurred to Descartes that the position of the fly at any instant could be defined by three numbers, the perpendicular distances from the three walls. And so was born the idea of the coordinate graph.
I have no idea if the story is true, but it struck me as marvelous at the time, as did all of my father’s stories. His graphs were marvelous, too. Lovely bell curves. Parabolas. Hyperbolas. Crisscrossing lines. He plotted everything. Stock prices vs. sunspot numbers. Sales figures vs. inflation rates. Gross national products vs. geographic latitudes.
Who knows what it all meant, or what he was looking for. The graphs were a way of teasing out hidden causal connections, showing that the world was not the higgledy-piggledy it sometimes appeared to be. He was a great believer in causality. Nothing happened without a cause; the cause just might not be obvious. He had no taste for miracles.
If anything influenced me to study science, it was the cumulative effect of all those hundreds of graphs, each one a little work of art in my father’s fine engineer’s hand. The thin colored lines on the green-gridded paper were like circuit diagrams of the universe, a glimpse of the hidden webs of causality that make the whole thing work.
Dad never knew much physics, but he had a physicist’s interest in the plumbing of reality.
When I went off to study physics, I suppose I was looking for the plumbing, too. In my very first physics lab, we rolled a marble down an inclined plane and plotted distances vs. times. A parabola! A perfect mathematical parabola. Nature revealing her hidden plan.
My lab reports were more notable for their neat, colorful graphs than for the quality of the physics.
As my father lay dying of cancer at age 64, he was still plotting, the many data of his illness, graph after graph, as if somehow the relationships would become clear and the independent variables could be properly adjusted to save him from what appeared to be an inevitable fate.
There were no miracles, of course, nor did he expect any. Nor was it higgledy-piggledy. The graphs moved toward their foregone conclusion.
It was cause and effect, all right. It was just a different effect than the one he’d hoped to find.


